 Classilist
Visualising Classifier Performance
Classilist is an open-source visualization dashboard, aimed towards visual analytics for probabilistic classification data. Having been developed as a Google Summer of Code'16 project, it is based on the Research Work done at CSE department of TUWien.
Classilist sports some features like - class-wise probability distribution, feature view analysis for feature distribution in the dataset, support for RapidMiner, KNIME and R to ease data formatting and export data which will be used by Classilist.
Classilist requires the classified data with class distribution in a format suited for its use. Data from different applications due to being in varied forms, can't be used directly and needs to be processed. Classilist support plugins available for some of the widely used applications do the data processing for you. Their installation and usage is explained in the further sections.
Classilist can be used with data from former or other applications without using the plugins after some manual manipulation of results, mentioned in details in Tutorials section.
-
Install Classilist Interface
Download & Install
- Download 'Classilist Interface' from Downloads & Links section
- Extract the zipped file (classilist.zip) and copy into the desired directory
- Now your Classilist Installation directory is [current-directory]/classilist
-
Install R Package
Method 1 : Install from Source
- Install Package 'devtools' ( How to install? )
-
Load Package 'devtools'
library(devtools) -
Install and Load Package 'classilistR' from BitBucket User : typhon23 and Repo : classilistR
install_bitbucket("typhon23/classilistR")
library(classilistR)
Method 2 : Download & Install
- Download 'R support package' from Downloads & Links section
-
Copy the zipped file (classilistR.zip) into the current working directory and extract.
Path of Current Working Directory can be found by getwd() -
Install and Load Package 'classilistR'
install.packages("classilistR", repos = NULL)
library(classilistR)
-
Install RapidMiner Plugin
Download & Install
- Download 'RapidMiner Operator Extension' from Downloads & Links section. If you are asked to 'keep' or 'discard' the .jar file, be sure to choose keep.
- Copy the .jar file (classilistRM-1.0.0-all.jar) to the RapidMiner plugins folder. Path of RapidMiner plugins folder is : [rapidminer-studio-home]/lib/plugins
- Start (Restart if already running) RapidMiner. In the operator tree, find Operator Extensions>Classilist>Classilist Group>Classilist Export
-
Install KNIME Plugin
Download & Install
- Download 'KNIME Node Plugin' from Downloads & Links section. If you are asked to 'keep' or 'discard' the .jar file, be sure to choose keep.
- Copy the .jar file (org.classilist.knime_1.0.0.jar) to the KNIME dropins folder. Path of KNIME dropins folder is : [KNIME-home]/dropins
- Start (Restart if already running) KNIME. In the node tree, find Node Classilist
- This will also work on Eclipse Installation of KNIME.
| Component | Source Link | Download Link |
|---|---|---|
| Classilist Interface | Source | Demo | Download |
| R Support Package | Source | Download |
| RapidMiner Operator Extension | Source | Download |
| KNIME Node Plugin | Source | Download |
-
Data : Basic Idea (Recommended Read)
Must-have-components of dataset to be visualized
- Target Column : Specifies the actual/target class of data sample.
- Predicted Column : Specifies the class predicted by classifier of data sample.
- Feature Column(s) : Attribute(s) that form the basis of classification.
- Probability Column(s) : Attribute(s) that specify the probability of the sample to classified into corresponding class. One Column for each class.
Methods to process data for Classilist Visualization Dashboard
- Use R support Plugin (See : 'How to use R support Plugin')
- Use RapidMiner Operator (See : 'How to use RapidMiner Operator Extension')
- Use KNIME Node (See : 'How to use KNIME Node Extension')
- Process Manually (See : 'How to Manually Process data')
Format of data (After Processing)
- Target Column header : A-<column_name>
- Predicted Column header : Predicted
- Feature Column header : F-<attribute_name>
- Probability Column header : P-<class_name>.
- File format: .csv
- <class_name> in Probability column header, Predicted Column entry, Target Column Entry should be consistent. They are used for mapping and are case-sensitive.
-
How to use R support Plugin
Video Tutorial
- Install and load R packageclassilistR(If not done already).
- Make sure the data set has all four components (See : 'Data : Basic Idea') and names of probability columns are consistent with those in Target Column for mapping.
-
Use the function
classilist(dataSet, location, features, predicted, actual, probs)
dataSet : Dataset with classified results
location : Classilist Installation Directory
features : String vector of Feature Attribute(s) name(s)
predicted : Predicted column name as String
actual : Target/Actual column name as String
probs : String vector of Class Probability Attribute(s) name(s). These should be the names of corresponding class.
You may be required to do this manually due to different conventions used by various R packages for naming of probability columns. - You should be able to see the dashboard in the system's default browser. If you want to view the dashboard in another browser, go to Classilist Installation Directory and open index.html with desired browser.
-
How to use RapidMiner Operator Extension
Video Tutorial
- Install RapidMiner Operator Extension(If not done already)
- In the operator tree, find Operator Extensions>Classilist>Classilist Group>Classilist Export
-
Use the operator by dragging it into a process. Its ports :
inp Input Port : Takes classification results ExampleSet as input, preferably directly from Apply ModelOperator or indirectly fromthrough ports of following operator(s).
thr Through Port: Gives ExampleSet taken in from inp for use in following operators.
fil File Port: Exports data in a file to be directly used by Classilist Interface. -
Make the connections as follows :
inp : Connect directly tolabport ofApply ModelOperator or indirectlythroughports of following operator(s).
thr : Optional Connection. Can be used to pass the input data to other operators or as Process results.
fil : No connection required. - Set location parameter to [classilist-installation-directory]/data/out.csv.
- Go to Classilist Installation Directory and open index.html in desired browser.
-
How to use KNIME Node Plugin
Video Tutorial
- Install KNIME Node Plugin(If not done already).
- In the node tree, find Node Classilist and drag it into the workflow.
- Connect its input to the output of a Classifier Predictor Node.
-
Configure the Predictor node to :
Uncheck Change prediction column name in order to enable correct data mapping.
Check Append columns with normalized class distribution in order to generate Class Probabilities. - Configure the Classilist node to set Classilist location parameter to [classilist-installation-directory]. This needs to be done every time before execution of node.
- Execute the Node.
- Go to Classilist Installation Directory and open index.html in desired browser.
-
How to Manually process data
Video Tutorial
- Get data in .csv format.
- Change name of Actual/Target Class column to A-<col_name> .
- Change name of Predcited Class column to Predicted .
- Change name of Feature columns to F-<feature_name> .
- Change name of Class probability columns to P-<class_name> . Make sure class_name is consistent with those in target and predicted class columns. These are case-sensitive.
- Save te file as out.csv at location[classilist-installation-directory]/data
- Go to Classilist Installation Directory and open index.html in desired browser.
-
How to begin with Classilist Interface (Recommended Read)
Launch Interface
- Install Classilist Interface(If not done already).
-
Go to Classilist Installation Directory and open
index.html in browser. OR Run it on localhost
This will launch the Classilist Interface. - If the interface is launched directly from the file, this may sometimes give a 'Data not found error' if the browser doesn't allow CORS for security issues. In this case, a dialog will appear stating this problems. Upload the file [classilist-installation-directory]/data/out.csv in that dialog and the interface will work fine from here.
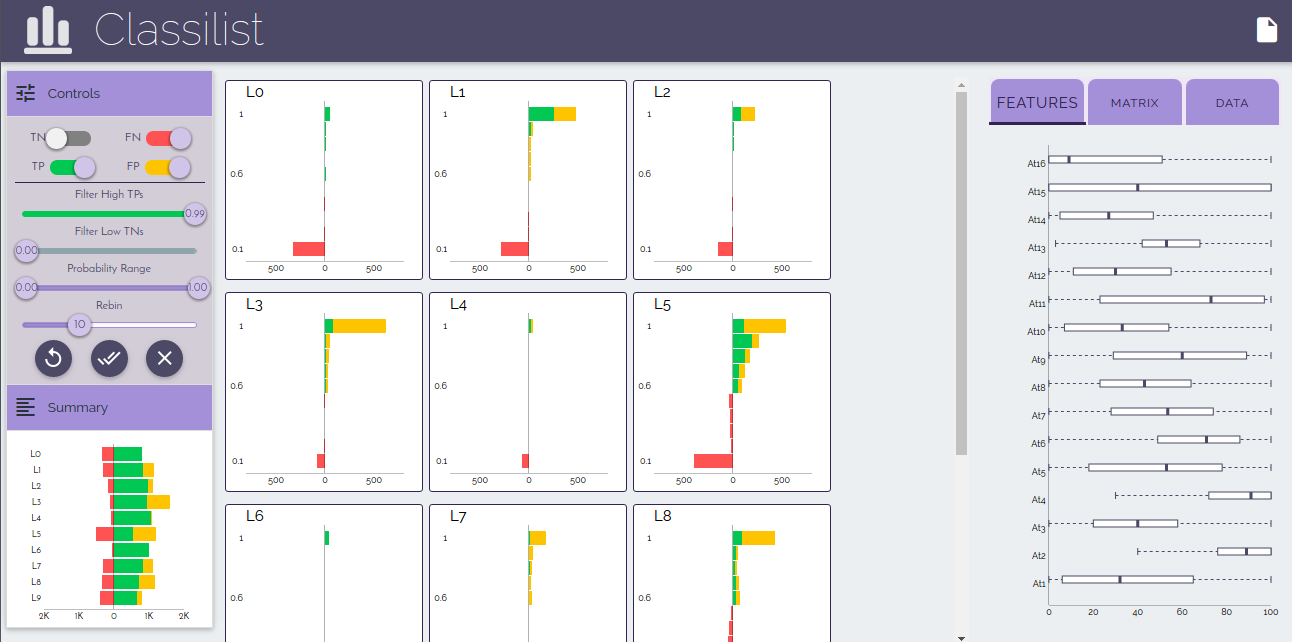
Interface Structure
-
Controls : Left Pane - Top
This section contains the controls to show or hide data based on various categories in the Probability Histograms in the Central Pane. (See : 'More into controls') -
Summary Distribution: Left Pane - Bottom
This section contains the histogram showing distribution of False Negatives, False Positives and True Positives. (See : 'More into Summary Distribution') -
Class Probability Distribution : Central Pane
This section contains histograms showing probability distribution of samples for each Target class. (See : 'More into Class Probability Distribution') -
Feature View : Right Pane - Tab 1
This section cntains Box Plots for all the features showing their distribution. One set (visible always) corresponds to complete dataset, another set (visible only for selections) corresponds to selections. (See : 'More into Feature View') -
Confusion Matrix : Right Pane - Tab 2
This section contains Confusion Matrix with some controls for better insight. (See : 'More into Confusion Matrix') -
Data : Right Pane - Tab 3
This section contains data samples (max 500 at a time). This area is more useful for selections when it display samples corresponding to selection only. (See : 'More into Data')
Loading new data
- While working on some data, you may want to load another classified dataset (already in Standard Classilist Format).
- Click on file icon on the top right corner of Interface to open the dialog.
- Upload the datafile (.csv) and click on 'Done'.
-
More into Controls
Video Tutorial
-
TN Switch :
Show (on) and hide (off) True Negatives of class probability distribution in Central Pane. Turned ON by default. -
FN Switch :
Show (on) and hide (off) False Negatives of class probability distribution in Central Pane. Turned ON by default. -
TP Switch :
Show (on) and hide (off) True Positives of class probability distribution in Central Pane. Turned ON by default. -
FP Switch :
Show (on) and hide (off) False Positives of class probability distribution in Central Pane. Turned ON by default. -
High TP filter
Slider to partially hide True Positives of class probability distribution in Central Pane. True Positives with probabilities of white colored part of slider are hidden. Value is 1.0 by default i.e. all True Positives are turned ON. -
Low TN filter
Slider to partially hide True Negatives of class probability distribution in Central Pane. True Negatives with probabilities of white colored part of slider are hidden. Value is 0.1 by default i.e. all True Negatives below probability 0.1 of belonging to Target class are turned OFF but can be turned on by adjusting the slider. -
Probability range filter
Slider to adjust the probability range of all the categories in all class probability distribution in Central Pane. Includes all probabilities by default. -
Rebin Slider
Slider to adjust the bins of histograms of class probability distribution in Central Pane for better and finer insights into probability distribution. Set to 10 bins by default. -
Reset Button
Reverses any changes made to the sliders and resets histograms to default values. -
Apply Button
Applies any changes made to the above four sliders don't take effect until this button is clicked. This button applies the new settings to the histograms in central pane. -
Clear selection button
Removes selections (See : 'What are selections') and brings dashboard to universal state.
-
TN Switch :
-
More into Summary Distribution
Video Tutorial
- This histogram shows the summary of dataset grouped by the Target class of samples.
- Each class corresponds to a bar in the histogram which is further divided into three parts : True Positives, False Positives and False Negatives.
- It doesn't show True negatives due their large values which overshadows other categories and also adds little to the analysis.
- This is important to highlight a specific category of a particular class in selections (See : 'What are selections').
- Hover over any of the partial bars displays the target class with the number of instance corresponding to the bar.
-
More into Class Probability Distribution
Video Tutorial
- This section has a histogram for each class which shows the distribution of dataset w.r.t that class.
- Data set is divided into groups (equal to no. of bins) by the probability of data sample of being classified into that class.
- Each group is further divided into categories of True Positives, true Negatives, False Positives and False Negatives to quantify the peroformance of classifier for that particular class.
- These histograms are affected by the left controls and also generate selections (See : 'What are selections') hence serve the best analytical selections for analysis and classifier performance measure.
- Hover over any of the partial bars displays the probability of the corresponding data of being classified into that class, category and number of such instances.
-
More into Feature View
Video Tutorial
- This section has a box plot distribution for each numerical feature which shows the distribution of that feature's values over the dataset.
- Another set of box plot distribution (invisible by default) for each numerical feature is present which shows the distribution of that feature's values over the selection, hence this is visible only when a selection is generated.
- Each Box plot has : Median Line , First quartile - Third Quatile box, whiskers which are placed at 1.5x of IQR (Inter quartile distance).
- These are affected by selections but doesn't generate selections.
- Hover over any of the parts of plots displays the value of median or quartiles or whisker value depending on the area of box plot being hovered on.
-
More into Confusion Matrix
Video Tutorial
- This section contains the confusion matrix for the dataset to depict relation between any two confused classes.
- Each pair of Actual-Predicted classes has a cell corresponding to it.
- The measure of each cell is either quantified by a color scale (same sized cells get darker with no. of instances) or size scale (same colored cells get bigger with no. of instances).
- Sometimes due to large values of diagonal cells(True Positives), it may overshadow other confused cell values (in terms of size or color scale) hence we have an option to turn off the diagonals to get better view of other non-diagonal (confused) cells.
- These cells are affected by selections and also generate selections, hence are very useful to study relationship between the any two classes using the confused data sample among the classes.
- Hover over any of the cells of matrix displays target class, predicted class and no. of such confused (or correctly identified in case of diagonal cells) instances.
-
More into Data
Video Tutorial
- This section has the dataset in the form of table, broken into pages of maximum 500 records.
- It contains the selection data when selection is active and complete dataset otherwise to give a gist of data corresponding to the selection.
- This section is affected by selections but doesn't generate selections.
-
What are Selections
Video Tutorial
- Selections are a subset of the complete dataset that are activated when any bar of summary distribution or probability histogram or any cell of confusion matrix is clicked.
- Activation of selections causes the data corresponding to the clicked item to replace data in the Data table of Right-pane.
- The summary distribution, probability distributions and confusion matrix itmes are disabled and new items corresponding to the selection are visible now.
- The box plots are disabled and new plots corresponding to the selection are visible now below the disabled ones to compare.
- To remove the selections and return to complete dataset view, click on Clear selection button in Controls on the left-pane.

Medha
Katehara
GSoC'16 Intern
India
Developer & Learner

Bilal
Alsallakh
Research Scientist, Bosch
Palo Alto, CA
Researcher & Mentor

Emma
Beauxis-Aussalet
PhD Student at CWI
Netherlands
Researcher & Mentor
Need assistance ... found a bug ... or have questions ??
Go on then ... we are all ears to hear from you.
medha.classilist@gmail.com
Don't forget to checkout our Installation and Tutorials sections. May be your questions have been answered there already.